pacman::p_load(ggrepel, patchwork,
               ggthemes, hrbrthemes,
tidyverse, haven)take home exercise 2
Purpose:
This task involves identifying areas for improvement in a classmate’s homework. In my understanding, there are two important aspects: one is that the student should clearly understand the assignment; the other is that the homework should be easy to understand and the problem should be clearly identified.
I have chosen the homework of “Chai Zhixuan.”
His homework is quite well-presented and easy to comprehend. However, to fully understand the assignment, let us read further.
For this purpose, we need to determine if there are any differences between schools in three subjects in Singapore. Additionally, we should consider whether Socioeconomic Status affects subject scores.
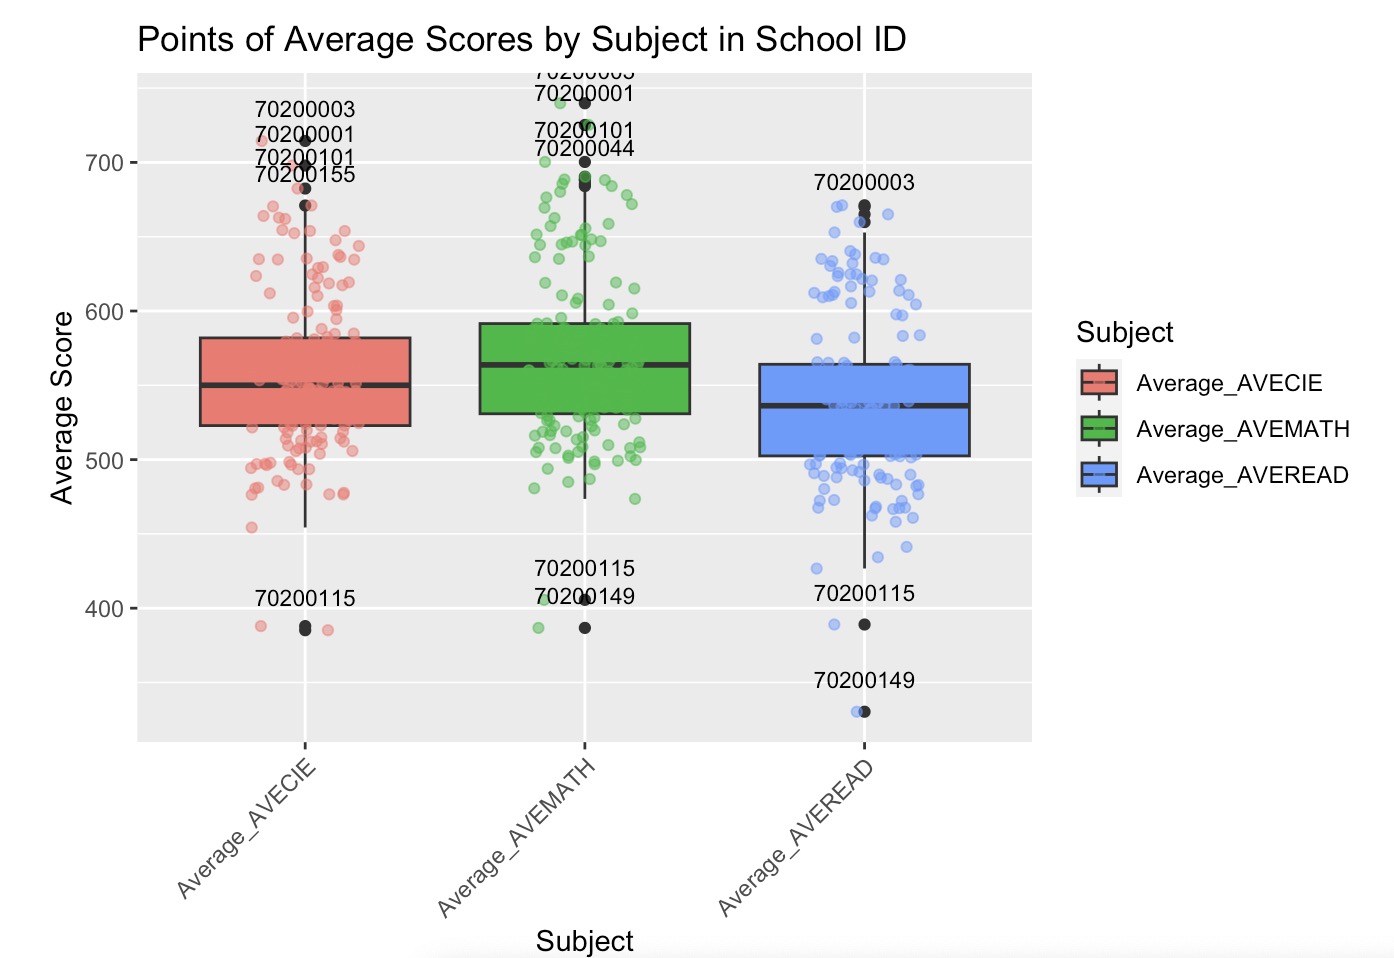
One misunderstanding
This is an incorrect understanding, because in our task, our purpose is to identify the differences between schools to make education more equitable. So, what we need to do is compare all schools in Singapore. Are there any differences between them? If Yes, we need to find out the reasons.
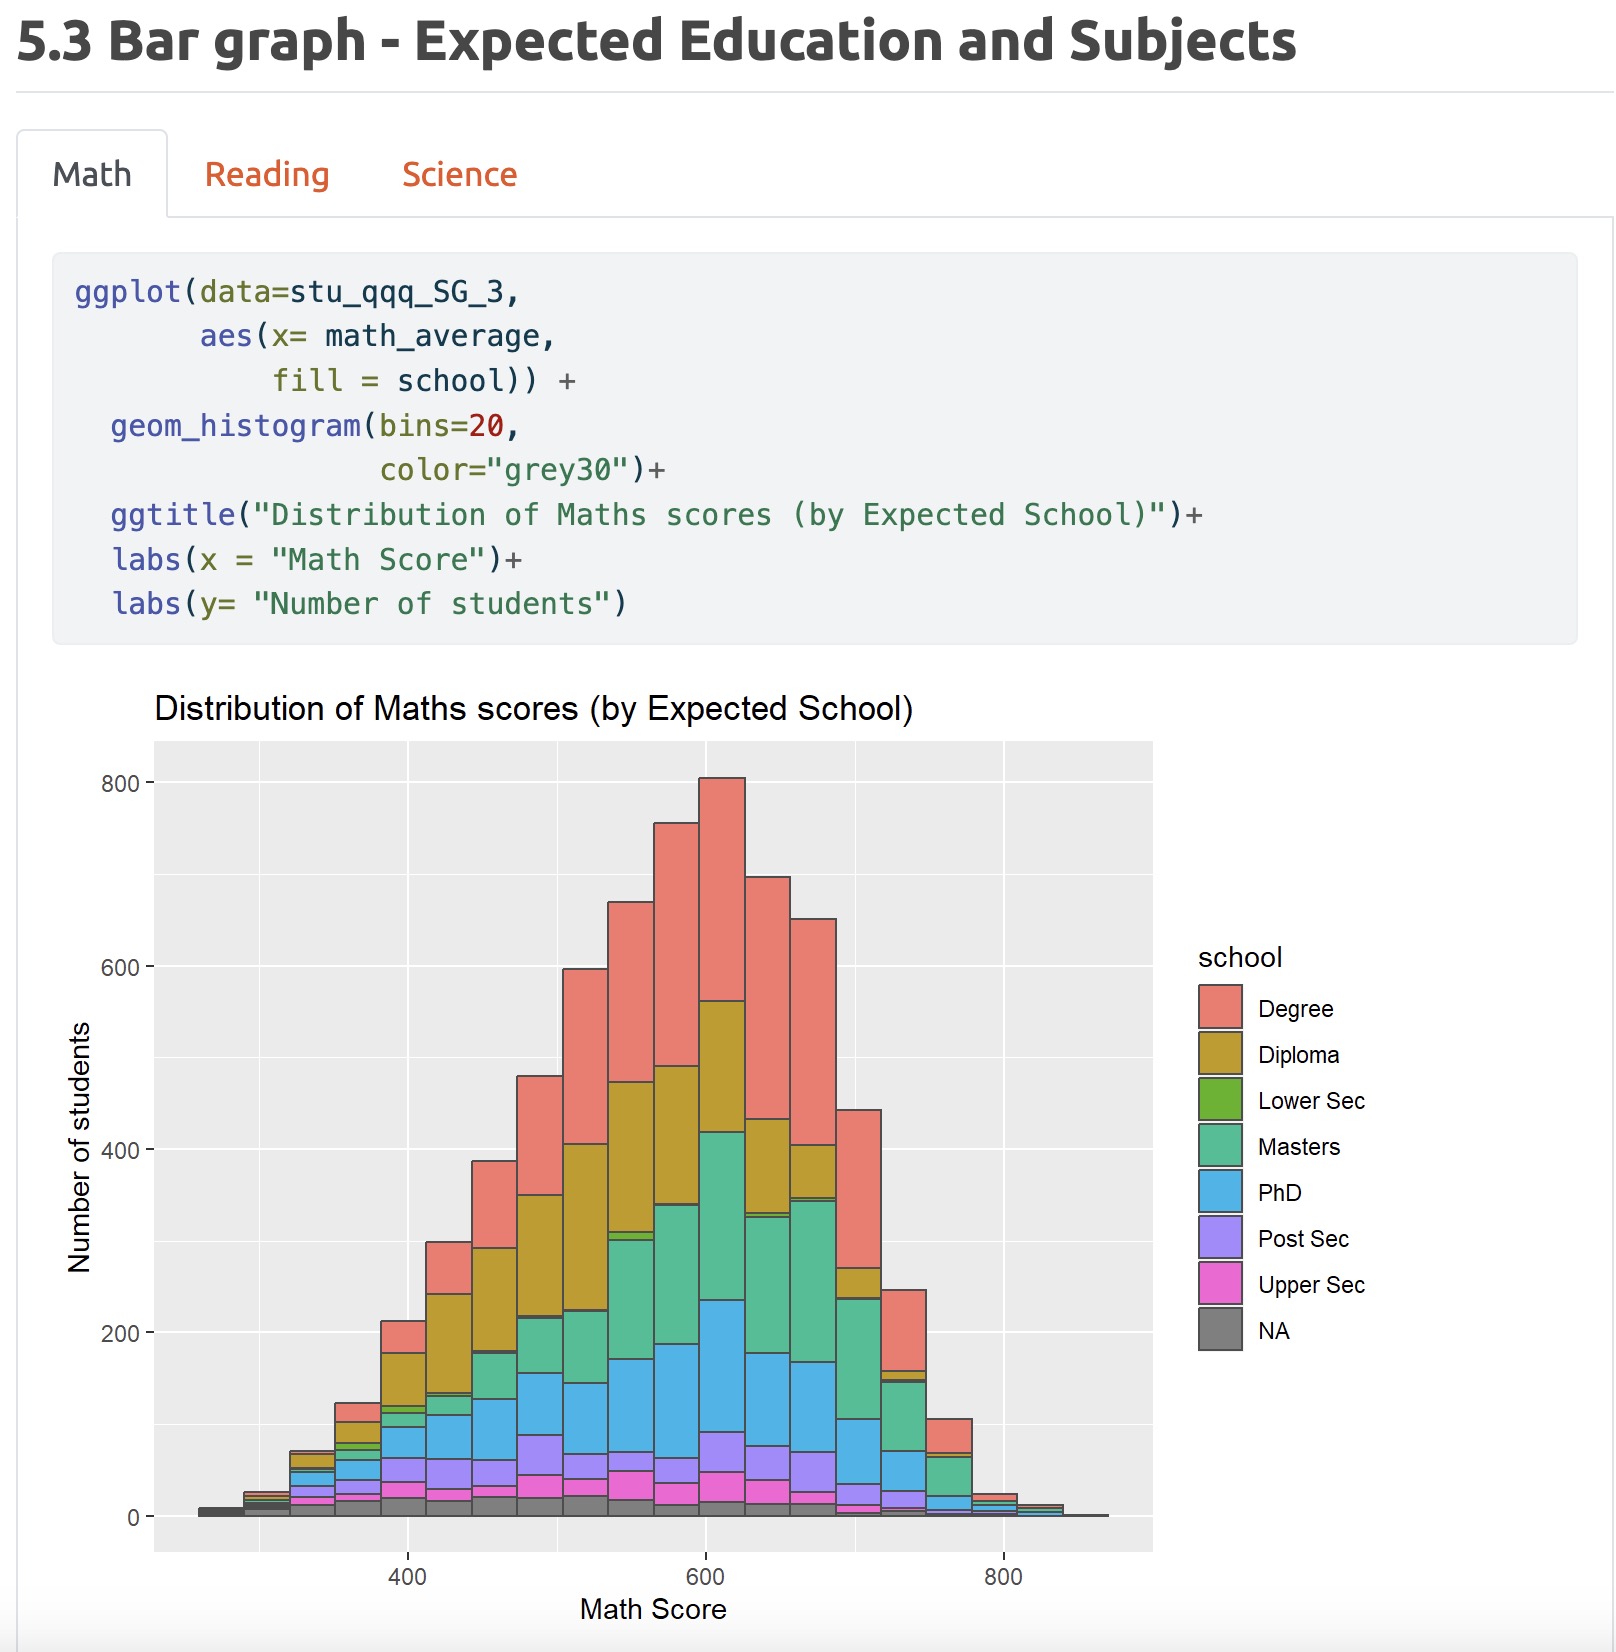
This is quite beautiful graph, but is not useful in our task. The proper one is below:
For this purpose, we just want to know the difference between different school,is it alomst same to the others. So this is not the right direction.
Another misunderstanding
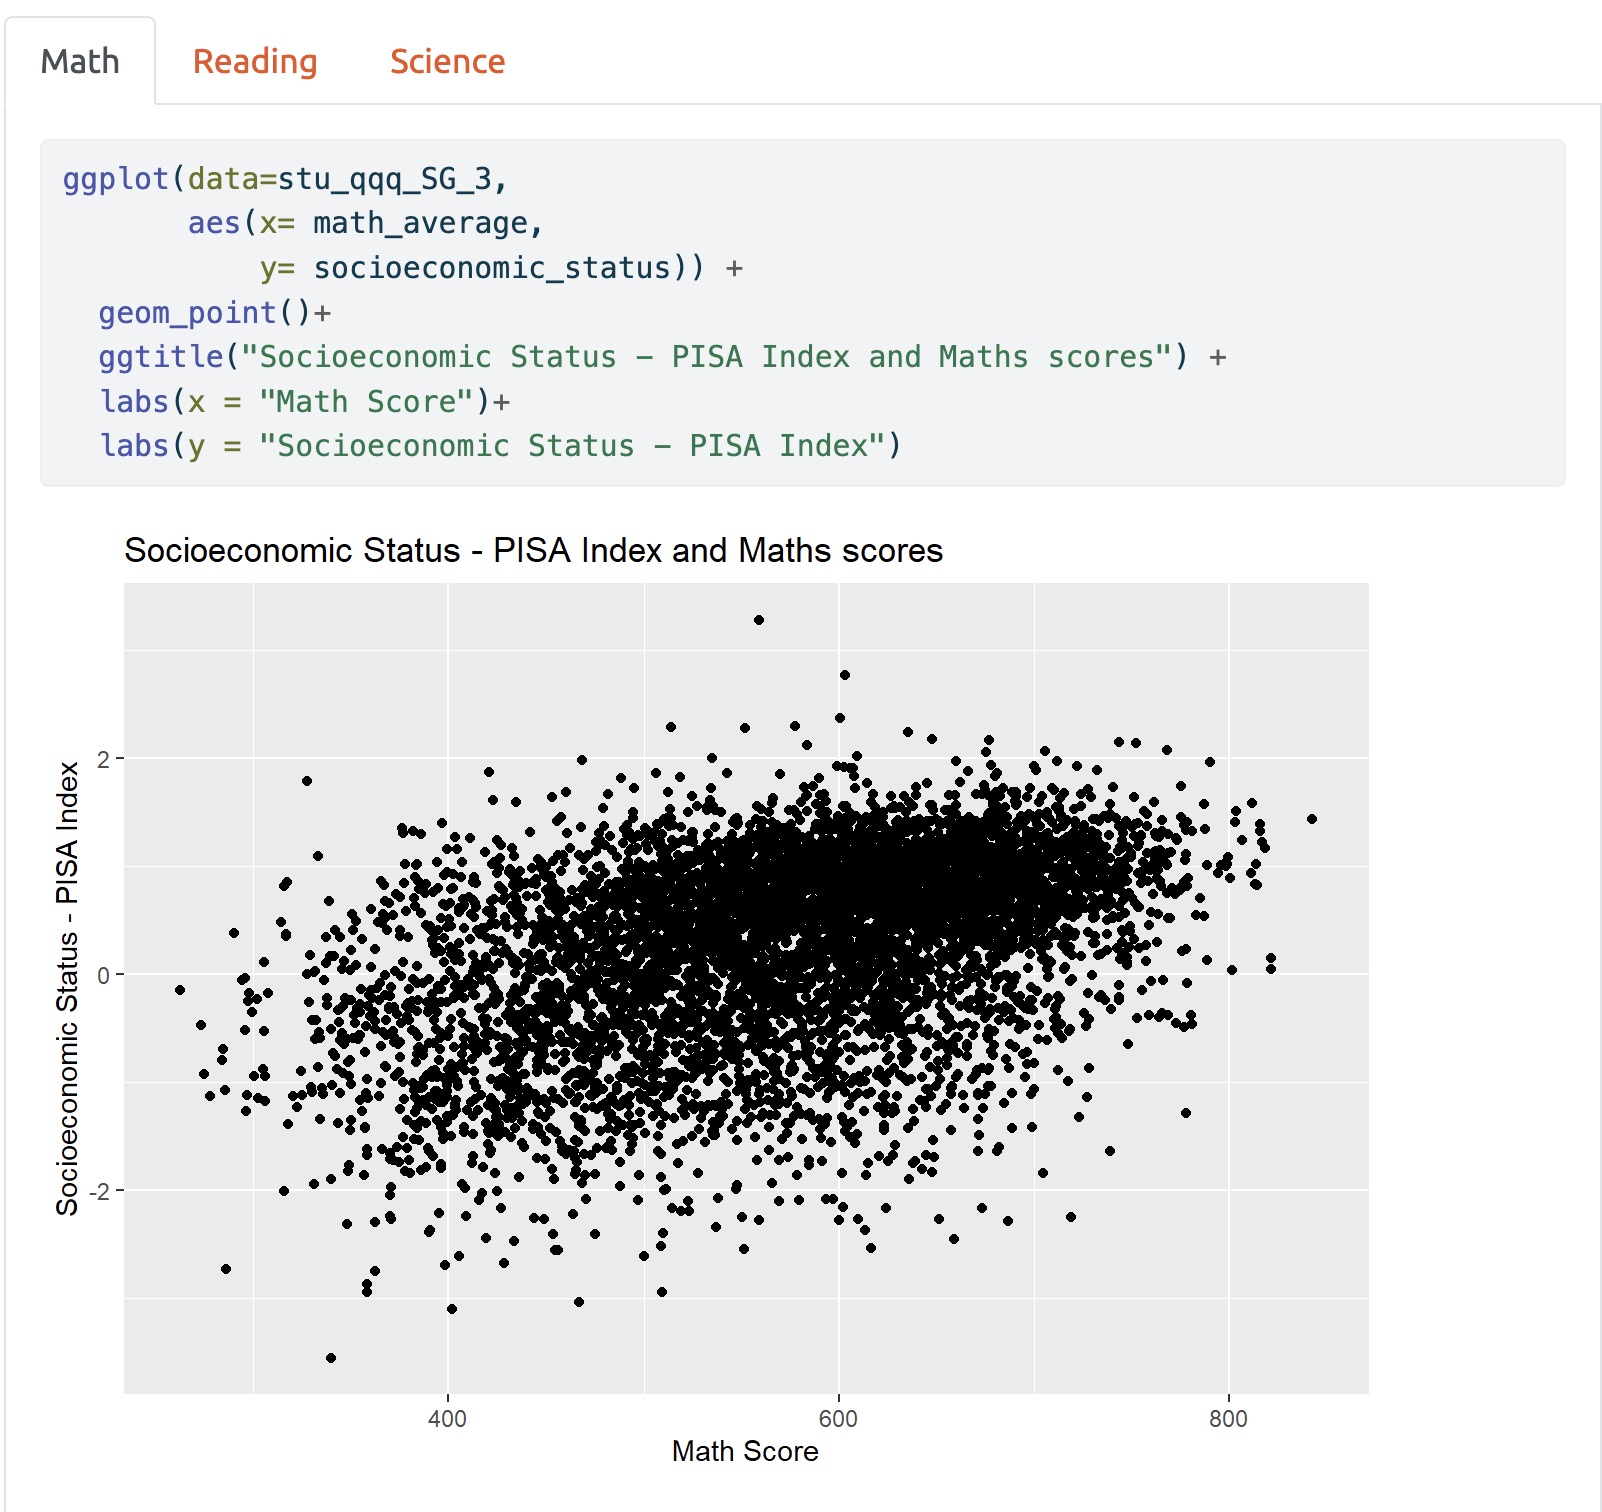
We want to find out that the relationship between Socioeconomic Status and Subjects Score.
stu_qqq_SG <- read_rds("data/stu_qqq_SG.rds")stu_qqq_SG_MRS <- stu_qqq_SG %>%
mutate(AVEMATH = (PV1MATH + PV2MATH + PV3MATH + PV4MATH + PV5MATH + PV6MATH + PV7MATH + PV8MATH + PV9MATH + PV10MATH ) / 10,
AVEREAD = (PV1READ + PV2READ + PV3READ + PV4READ + PV5READ + PV6READ + PV7READ + PV8READ + PV9READ + PV10READ )/ 10,
AVESCIE = (PV1SCIE + PV2SCIE + PV3SCIE + PV4SCIE + PV5SCIE + PV6SCIE + PV7SCIE + PV8SCIE + PV9SCIE + PV10SCIE )/ 10)ggplot(data = stu_qqq_SG_MRS, aes(x = ESCS, y = AVEMATH)) +
geom_point() +
geom_smooth(method = "lm", se = FALSE) + # Add a linear model without the confidence interval
ggtitle("Socioeconomic Status - PISA Index and Maths scores") +
labs(x = "Socioeconomic Status - PISA Index", y = "Math Score")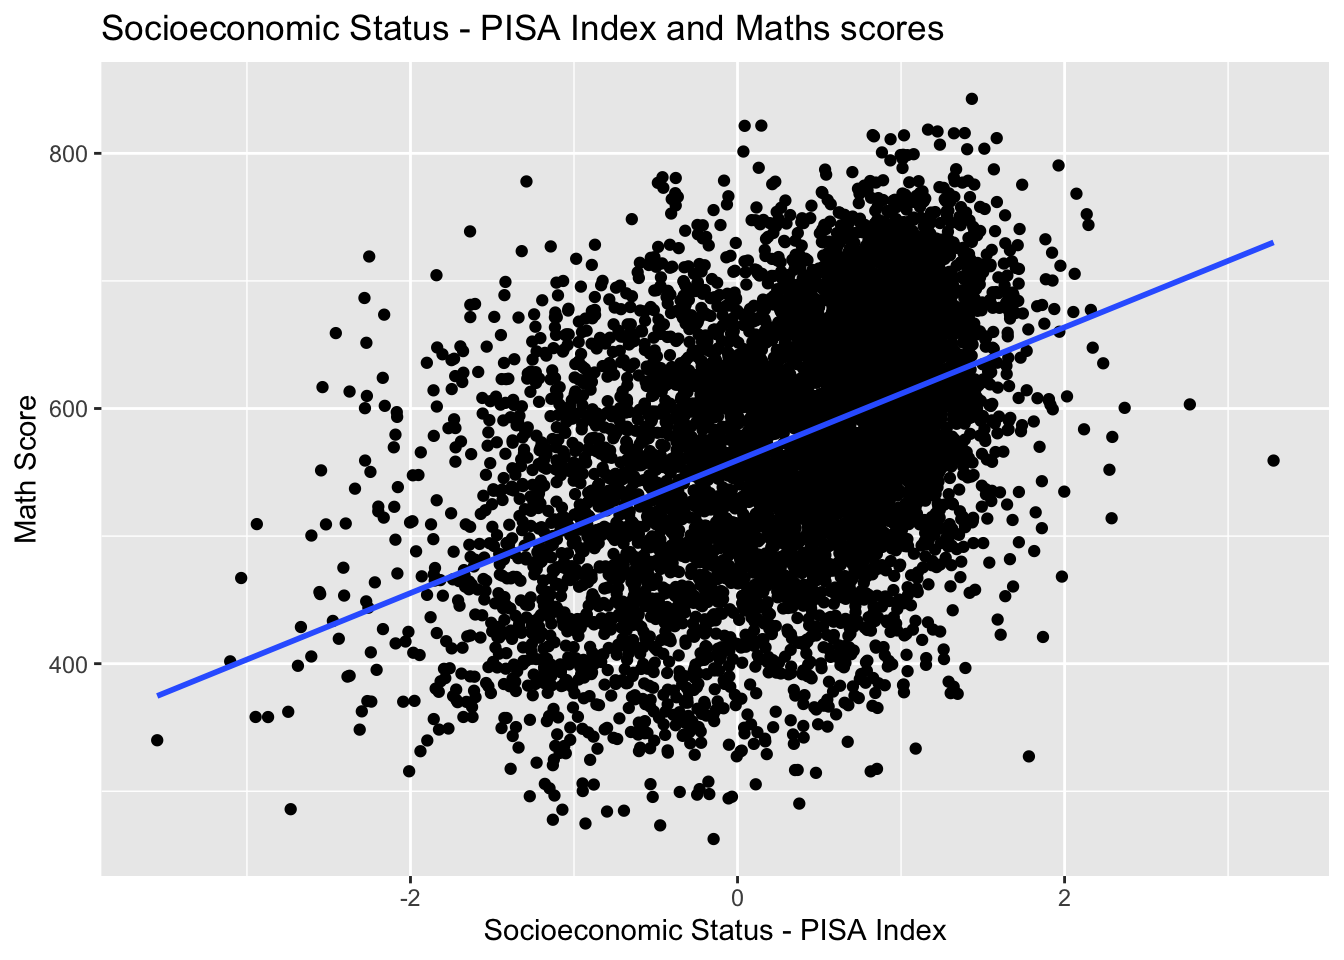
Convert X to Y, and add a linear regression. From this chart, we can see the positive between socioeconomic status and maths scores.
ggplot(data=stu_qqq_SG_MRS,
       aes(x= AVEREAD ,
           y= ESCS)) +
  geom_point()+
  geom_smooth(method = "lm", se = FALSE) +  # Add a linear model without the confidence interval
  ggtitle("Socioeconomic Status - PISA Index and Reading scores") +
  labs(x = "Reading Score")+
  labs(y = "Socioeconomic Status - PISA Index")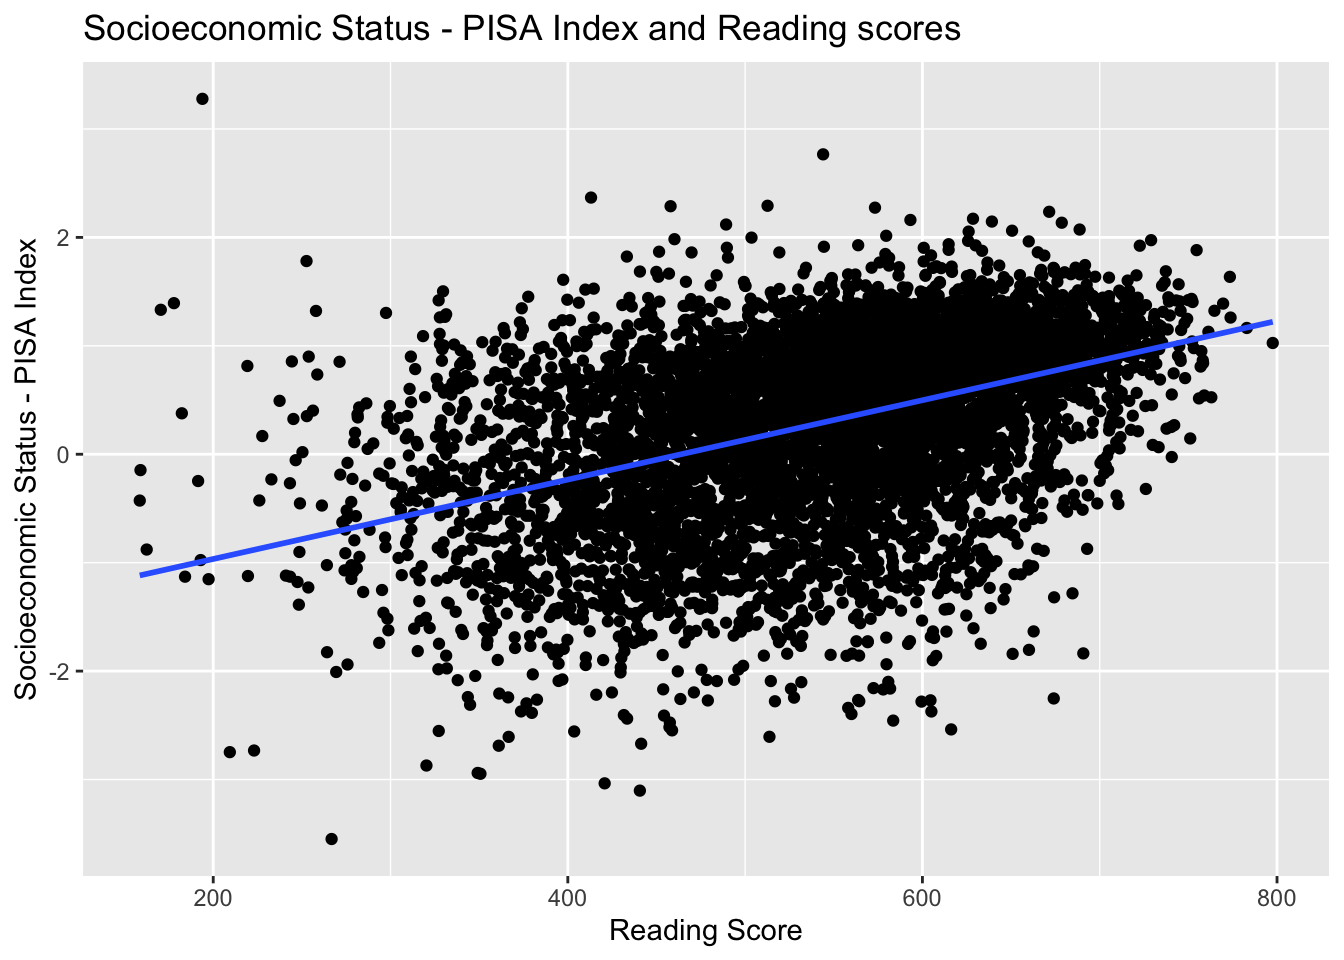
Convert X to Y, and add a linear regression. From this chart, we can see the positive between socioeconomic status and read scores.
ggplot(data=stu_qqq_SG_MRS,
       aes(x= AVESCIE ,
           y= ESCS)) +
  geom_point()+
  geom_smooth(method = "lm", se = FALSE) +  # Add a linear model without the confidence interval
  ggtitle("Socioeconomic Status - PISA Index and Science scores") +
  labs(x = "Science Score")+
  labs(y = "Socioeconomic Status - PISA Index")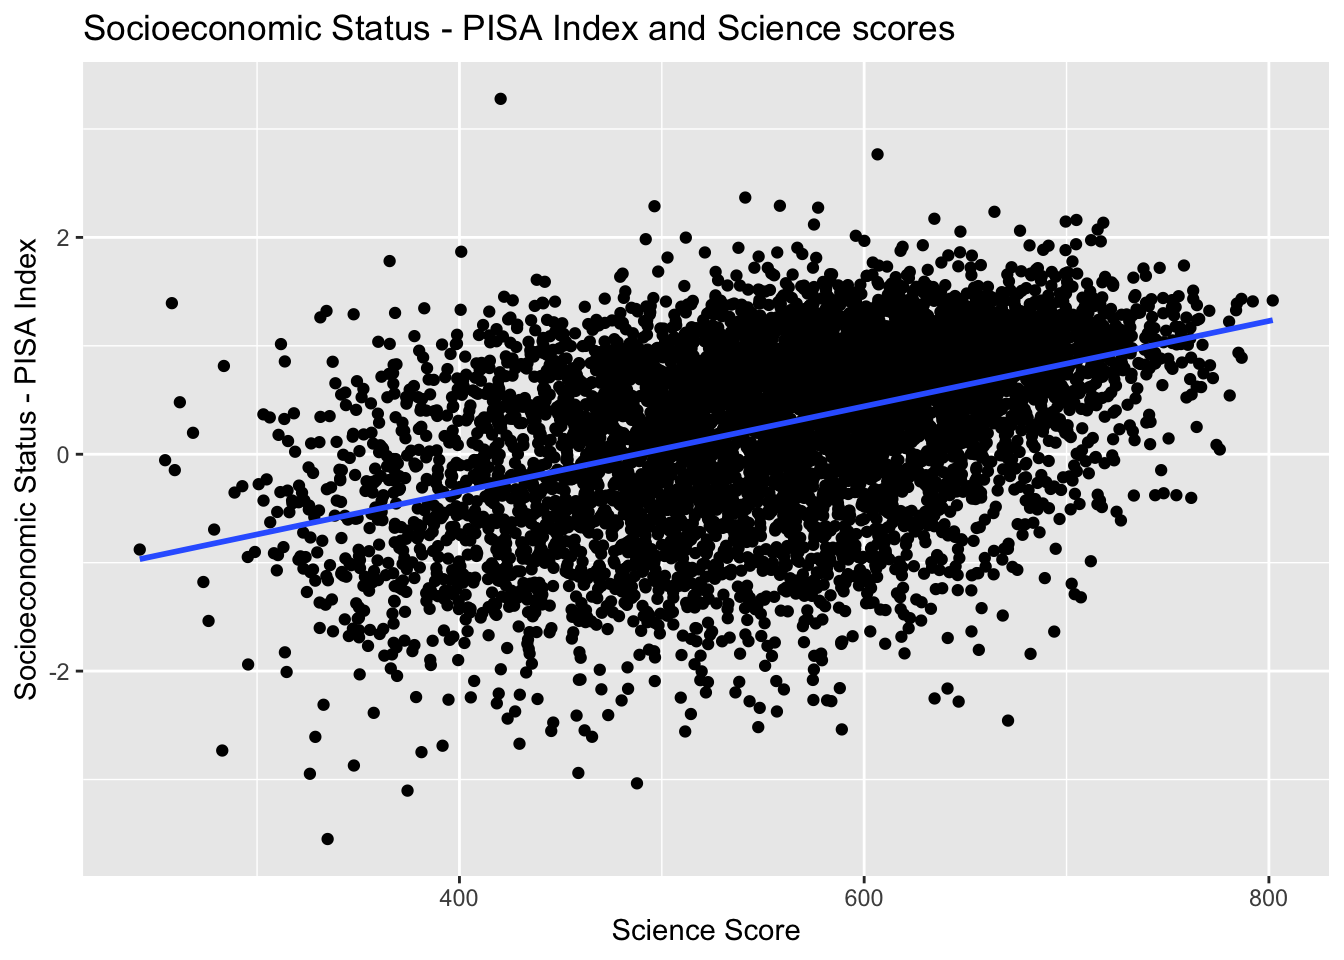
Convert X to Y, and add a linear regression. From this chart, we can see the positive between socioeconomic status and science scores.
Summary
The most important thing for me is to correctly understand the meaning of the question and to identify the problem.